The Task Manager is a useful tool for monitoring system activity, terminating misbehaving processes, and performing some high-level performance analysis. It runs at a higher priority than normal applications, and it has sufficient privilege to view and control the system's running processes. There are a couple of ways to invoke the task manager (regardless of which Windows system you use): either right-click the task bar and choose "Start Task Manager" from the Context menu, or press Ctrl+Shift+Esc. Either way, Windows displays the Task Manager.
The following figure shows the Applications tab of the Windows 7 Task Manager: (See Figure 1.)
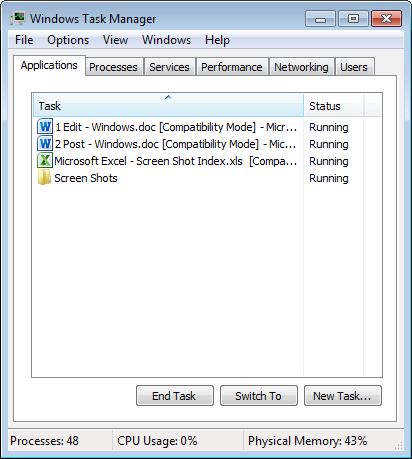
Figure 1. The Applications tab of the Windows 7 Task Manager.
Notice that there are six tabs: Applications, Processes, Services, Performance, Networking, and Users. The tab that initially gets the focus is the tab that had the focus the last time the Task Manager was used.
The Applications tab gives you a quick look at the applications running on your system and allows you to easily terminate them, bring up an application's window, or create a new application. (See Figure 2.)
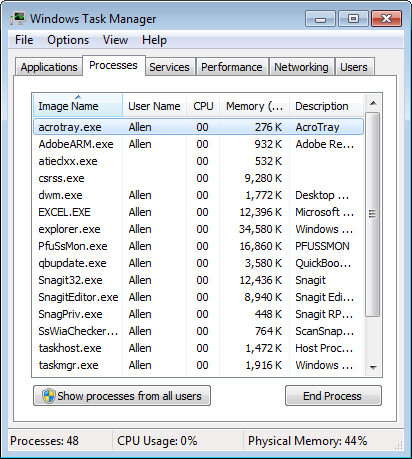
Figure 2. The Processes tab of the Windows Task Manager.
The Processes tab provides details about all of the processes running on the system. By pulling down the View menu you can configure what columns should be shown in the display. Effective use of the information provided with each process lets you find those that might be exhibiting memory leaks or consuming an inordinate amount of CPU time. You can also terminate processes from this tab. (See Figure 3.)
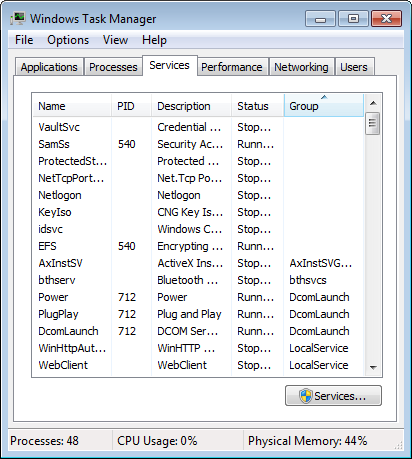
Figure 3. The Services tab of the Windows Task Manager.
The Services tab displays information about the Windows services installed on your system. By right-clicking on a service, you can start a stopped service, stop a running service, or immediately go to the process using a service. By clicking the Services button you can bring up the Services application, where you have full control over your services. (See Figure 4.)
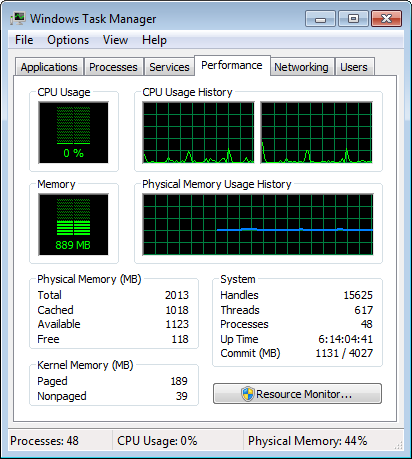
Figure 4. The Performance tab of the Windows Task Manager.
The Performance tab displays some graphs and some numbers. The top two graphs show CPU usage over time and range between 0% (an idle system) and 100% (a very busy system). The CPU Usage History graph can display one graph for all CPUs, or a separate graph for each CPU core. The Memory graphs show the amount of physical memory in use and range between something greater than 0 and the amount of installed memory. If you're consistently seeing high numbers here, then you could probably benefit from adding more memory.
The numbers part of this tab is separated into groups for Physical Memory, System, and Kernel Memory. Under Physical Memory there are two important numbers: the total amount of memory installed on the system (16 GB in my case), and how much is available for use (11172 MB). If the amount of available memory is low, the system will use the disk as virtual memory and performance will suffer.
Under the System group the important numbers are Handles, Threads, and Processes. A process is an instance of an executable program. Each process can be multi-threaded across the CPUs, and each thread can have multiple I/O handles open to system resources.
The Kernel Memory group simply indicates how much physical memory is being used by system-level processes and device drivers.
Clicking the Resource Monitor button brings up a utility that provides much more detail about the CPU, Disk, Network, and Memory. (See Figure 5.)
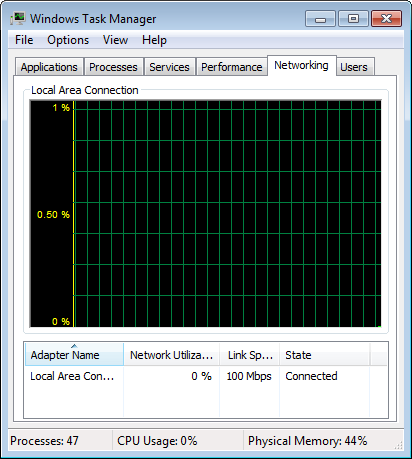
Figure 5. The Networking tab of the Windows Task Manager.
The Networking tab is one of the least interesting and least useful displays of Task Manager. The graph shows network activity as a percentage of network utilization, and on a dormant client node, this doesn't give much to look at. You can see more information by pulling down the View menu and selecting additional columns to be shown in the display—perhaps Bytes Sent and Bytes Received. (See Figure 6.)
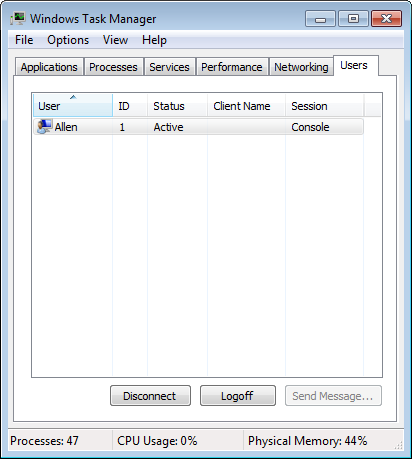
Figure 6. The Users tab of the Windows Task Manager.
The Users tab simply provides a list of users who are currently logged in. By selecting a user (other than yourself), you can send that user a message. Additionally, you can disconnect or log the user off the system.
There are seven tabs in Task Manager using Windows 8 and Windows 10: Processes, Performance, App History, Startup, Users, Details, and Services. (See Figure 7.)
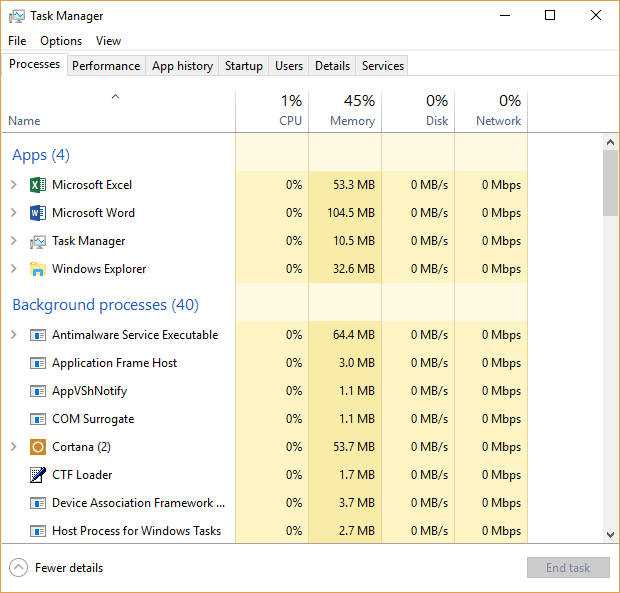
Figure 7. The Windows Task Manager dialog box.
The Processes tab shows how everything on your system is performing at the current time thereby telling you how they are using system resources. You will be able to see if a program or service is causing problems with your system. Effective use of the information provided with each process lets you find those that might be exhibiting memory leaks or consuming an inordinate amount of CPU time. You can also terminate processes from this tab. (See Figure 8.)
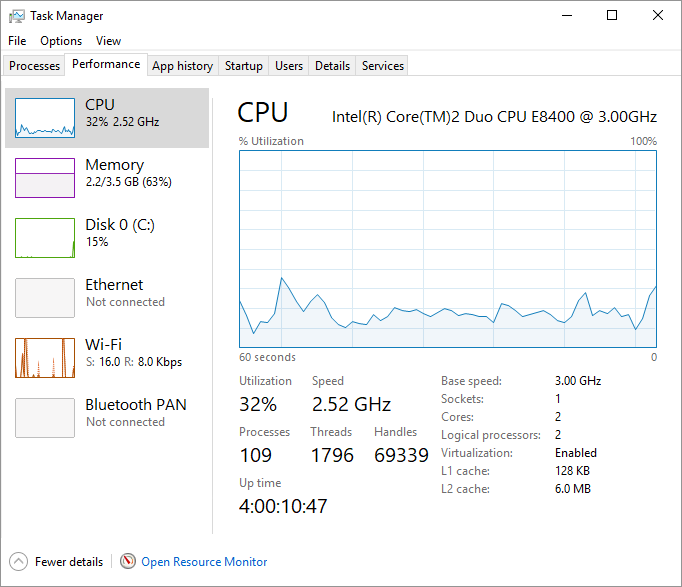
Figure 8. The Performance tab of the Windows Task Manager.
The Performance tab displays some graphs and some numbers that provides more detailed information about where system resources are being used. The top graph shows CPU usage over time and range between 0% (an idle system) and 100% (a very busy system). The Memory graphs show the amount of physical memory in use and range between something greater than 0 and the amount of installed memory. If you're consistently seeing high numbers here, then you could probably benefit from adding more memory.
The Disk section displays the model number of the drive and the type of drive at the top of the window and you can see how much of the drive is formatted, if it is a system disk, and whether it contains a page file. The top graph, titled Active time, shows the percentage of time the disk is processing read or write requests on a scale of 0-100 within a 60-second period of time. The bottom graph, titled Disk transfer rate, shows the transfer rates between the hard disk and the system itself over a 60-second period of time. The Wi-Fi section shows the name of the wireless card at the top of the window along with the name of the adapter, the SSID, the connection type, the IPv4 address and IPv6 address, as well as the signal strength. (See Figure 9.)
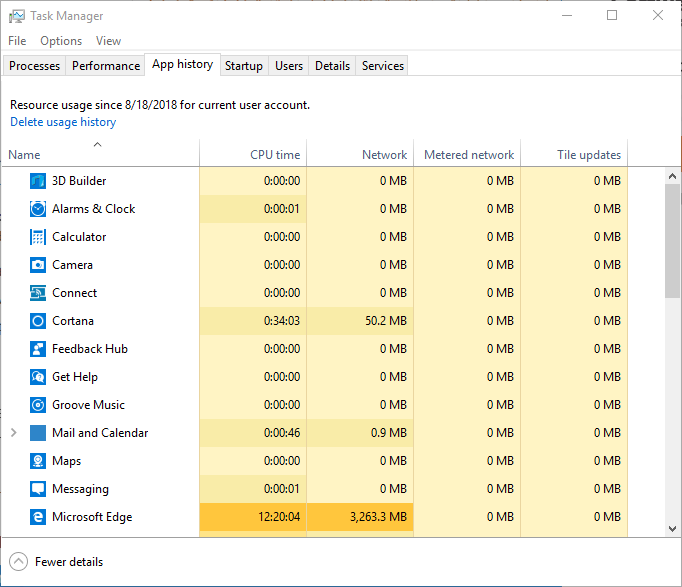
Figure 9. The App History tab of the Windows Task Manager.
The App History tab keeps up-to-the-second information on resources Windows apps use through certain dates. (See Figure 10.)
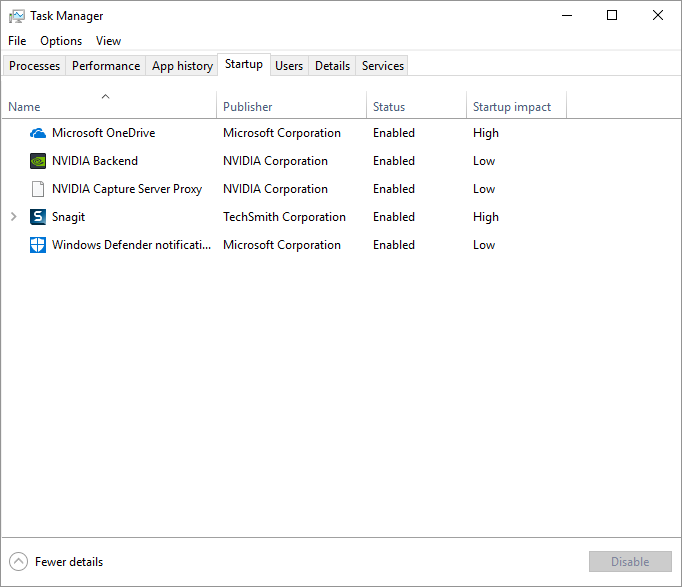
Figure 10. The Startup tab of the Windows Task Manager.
The Startup tab shows every process that starts up when Windows is booted up. Turning off any programs that take longer than five seconds at boot can make a significant difference in performance. (See Figure 11.)
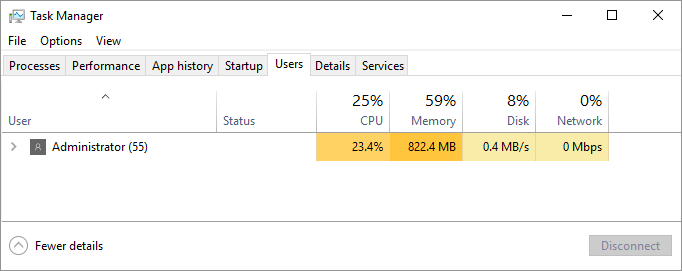
Figure 11. The Users tab of the Windows Task Manager.
The Users tab shows all the users currently logged into Windows and also show which system resources they are utilizing. You can also disconnect or log the user off the system by right-clicking on the particular user. (See Figure 12.)
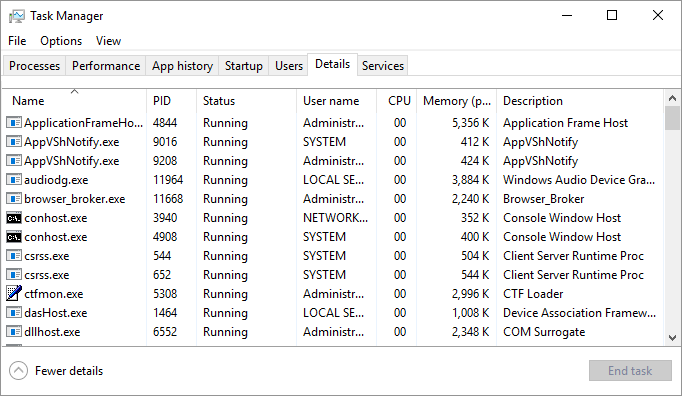
Figure 12. The Details tab of the Windows Task Manager
The Details tab, as the name implies, gives much more detail or information on the running processes on your system. These processes may or may not show up in the Processes or Performance tabs. (See Figure 13.)
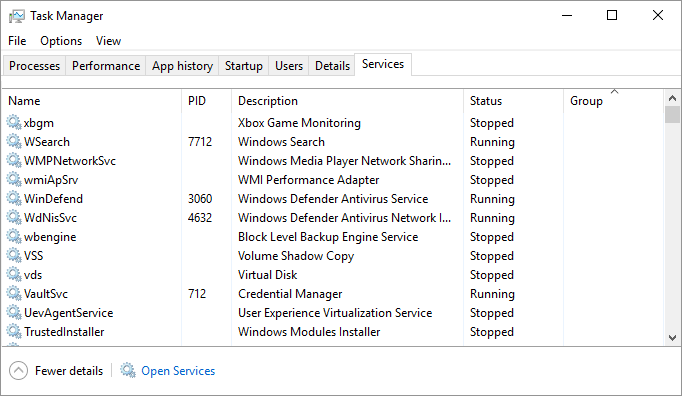
Figure 13. The Services tab of the Windows Task Manager
The Services tab displays information about the Windows services installed on your system. By right-clicking on a service, you can start a stopped service, stop a running service, or immediately go to the process using a service. By clicking the Open Services button, you can bring up the Services application, where you have full control over your services.
![]()
![]()
![]() This tip (12208) applies to Windows 7, 8, and 10.
This tip (12208) applies to Windows 7, 8, and 10.
If you want to conserve energy or preserve your laptop's battery life, you should know about hibernate and sleep. There ...
Discover MoreWindows has had cut and paste functionality for years. Windows 10 improves the Clipboard functionality by including a new ...
Discover MoreThink your system might be infected with a virus? How would you know if it was? Here are some quick indicators that your ...
Discover More2018-11-19 18:59:59
Kevin
It would appear as though a previous Figure 1 has been removed and the subsequent "See figure" values have not been updated.
The screenshots may have been produced on other than the writers "total amount of memory installed on the system (16 GB in my case)".
A clear heading relating to the separation between Windows 7 and Windows 8/10 could assist.
Copyright © 2026 Sharon Parq Associates, Inc.
Comments