Process Monitor from Sysinternals is a great diagnostic tool when you want to figure out what is going on with process and/or files. I introduced this tool in the tip titled Understanding Process Monitor. In this tip I'll show you how to actually use some of its features in diagnosis.
In this first scenario, imagine that you have a process running, but it doesn't seem to be doing anything. You'd like to know if it's hung or if it is in fact doing something that you just can't detect at the moment. As with all diagnoses, there may be several approaches you can take, but since this tip is focusing on Process Monitor we'll use its capabilities to see what's going on.
Launch Process Monitor and see if you can observe your process scrolling by under the Process Name column. If you don't see it, try searching for it by clicking the binoculars icon ("Find") and typing the process name (include its extension, e.g. type "MyProgram.exe"). If it is found, Process Monitor stops scrolling and highlights the row where it first finds the process name. If you aren't sure of the .exe name, you can use the "Include Process from Window" icon (eighth from the left). You use this by clicking and dragging the icon to the window where your process is running. Once you have dragged the icon to the window, release the mouse, and Process Monitor will go to the row where that window's process is found. At this point you can filter out everything about that particular process so you can watch it for activity without being distracted by everything else going on.
Filtering is a powerful yet simple concept in Process Monitor. A filter can be set to include entries or to exclude entries. It's important to realize that if there is an "include" filter turned on, then only those entries that match the filter will be displayed. On the other hand, if you have "exclude" filters turned on, then everything except what's in the filter will be displayed. "Include" filters always take precedence over "exclude" filters.
Click the Filter icon (the upside-down pyramid). Notice that Process Monitor has automatically already created an "include" filter for the process it found so you really don't have to do anything but click Cancel on the filter window and watch for activity from your process in the main screen. (See Figure 1.)
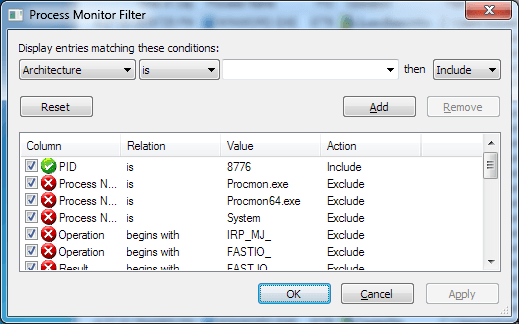
Figure 1. Process Monitor Filter window.
In a second scenario, let's say that there is a file on your hard drive that intermittently exhibits odd behavior. For example, its Modified date occasionally changes or sometimes processes crash because of a "file locked by another user" error. You can use Process Monitor to watch the file and see what processes are accessing it.
Launch Process Monitor. Since you set a filter the last time you ran Process Monitor, it remembers this setting and brings up the Filter window automatically. You want to start this session with a clean slate, so click the Reset button to return the filtering criteria to their default settings; then click OK.
Assume the file you want to watch is named "C:\Temp\Indexes.dat". Again, you could watch the information in the main screen for your file to appear in the Path column, but it would probably be easier to click the Filter icon and make an "include" filter so that only activity relative to that file appears.
Click the Filter icon and in the top left dropdown list select "Path"; then type "C:\Temp\Indexes.dat" (without the quotes) into the box just to the right of the dropdown list containing the word "is." (See Figure 2.)
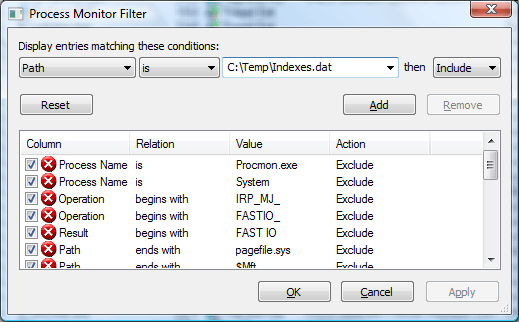
Figure 2. Filtering on a particular file name.
Now click the Add and the OK buttons to return to the main screen. Now you'll be able to see exactly when the file is accessed, and what process is doing it.
In a final scenario, let's say that you notice what seems to be an extraordinary amount of hard disk activity going on. You can use Process Monitor to take a snapshot of this activity for subsequent analysis. Launch Process Monitor and reset the filtering to its default condition as you did in scenario two. Then, when you are at the main screen, click the "Capture" icon (third from the left). This causes a snapshot of the current activity to be taken and the scrolling is stopped.
To now look at the disk activity of this snapshot, click the Tools | File Summary menu item. The File Summary dialog box is displayed, which includes all of the file activity captured by the snapshot. (See Figure 3.)
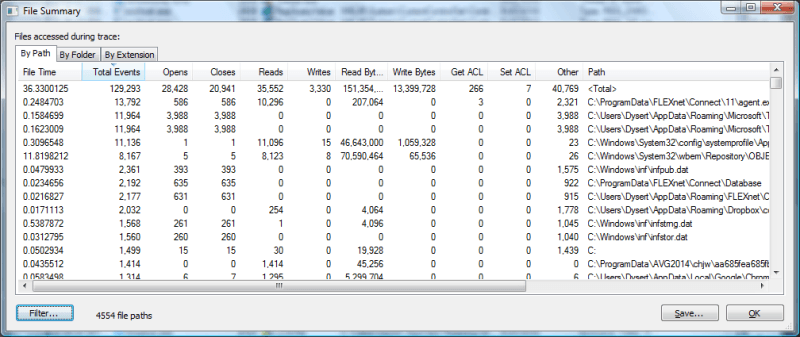
Figure 3. File Summary by path.
This summary is currently sorted by the Total Events column, but clicking on a column heading sorts the data by that particular field. It is also interesting to click the "By Folder" tab to see the files grouped by their names. (See Figure 4.)
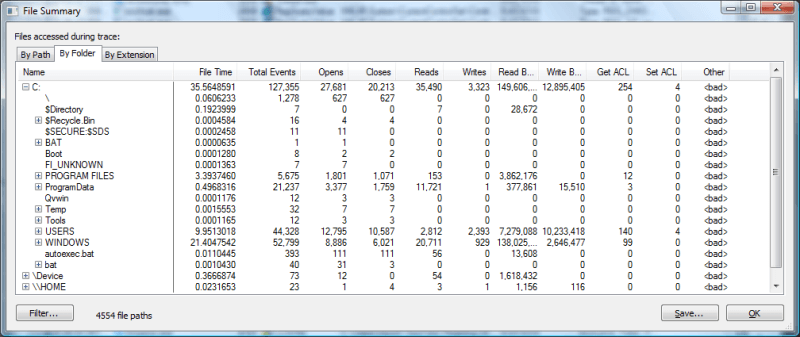
Figure 4. File Summary by folder.
Now you can drill down by clicking the plus signs on the left and seeing what all files are being accessed.
This tip has presented three scenarios that you may come across where Process Monitor can be used in diagnosing issues. You may have noticed along the way that there are many more icons and menu items that have not been addressed. As was said in the beginning, the best way to discover what Process Monitor can do is to experiment with it on your own.
![]()
![]()
![]() This tip (13120) applies to Windows 7, 8, and 10.
This tip (13120) applies to Windows 7, 8, and 10.
Maximizing your system's performance is an ongoing activity that requires in-depth knowledge of various components. ...
Discover MoreWould you like to have one place to go in order to see what all programs are starting when your system starts or when you ...
Discover MoreReliability Monitor provides some measure of how stable your system is. It does this by noting, over time, various types ...
Discover MoreThere are currently no comments for this tip. (Be the first to leave your comment—just use the simple form above!)
Copyright © 2026 Sharon Parq Associates, Inc.

Comments