The folks at Sysinternals produce some high-quality and very useful Windows tools. Another tip talks about their Process Explorer, so I thought I'd introduce you to their Process Monitor tool. Process Monitor is great for monitoring all the activity that goes on for all the processes on your system. In fact, its default configuration makes it too good because you are quickly overwhelmed by how much data gets presented to you. Don't worry, though—you'll learn how to filter the data so that you can hone in on exactly what you want to monitor without being overwhelmed with data you don't care about.
With Process Monitor, you can capture process details, including image path, command line, user and session ID; configure the GUI to have it present whatever columns are of interest; set include/exclude filters for any data field—even those whose columns are not displayed; and much more. Personally, I use it the most when I want to track activity on a particular file or track exactly what a certain process is doing.
The best way to understand Process Monitor is to actually use it, so the first thing to do is to download it from their site:
http://technet.microsoft.com/en-us/sysinternals/bb896645.aspx
Process Monitor is a simple .exe file that can be run either from the command line or from Windows Explorer. The first time you launch it, you're presented with an agreement that you should click to agree with. From then on, you'll be able to run it without seeing that initial screen.
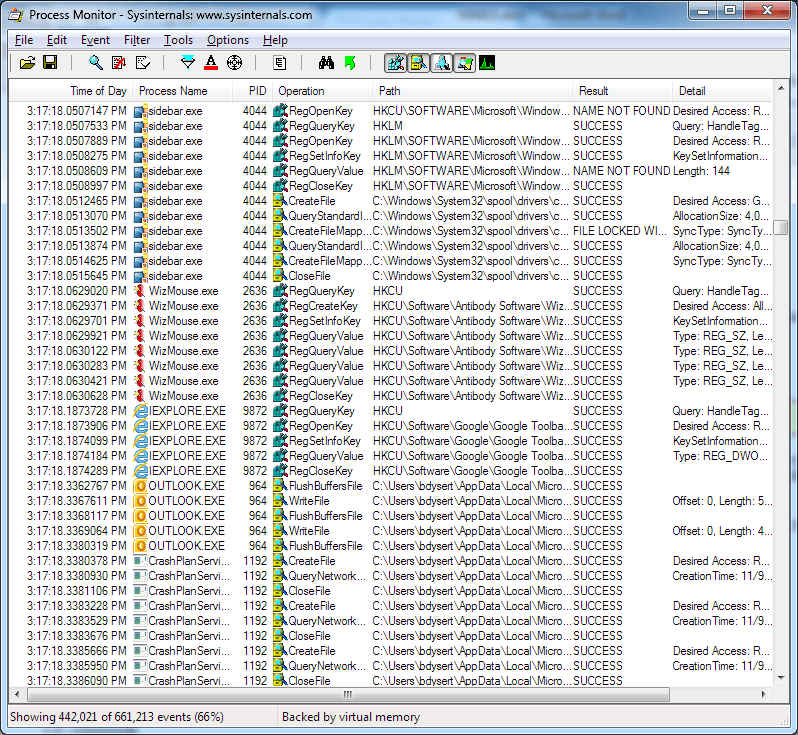
The screen for Process Monitor is displayed below. (See Figure 1.)

Figure 1. Process Monitor main screen.
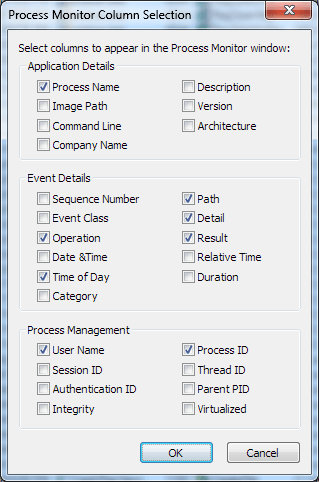
By default, as soon as it comes up Process Monitor starts scrolling thousands of lines of data about the activities going on with most of the processes on your system. The columns that are displayed are configurable. On my system I have it configured to display the Time of Day, Process Name, PID, Operation, Path, Result, and Detail columns related to the activities being monitored. You can change what columns are displayed by right-clicking one of the column headings to display the Process Monitor Column Selection dialog box. (See Figure 2.)

Figure 2. Selecting columns.
You can even change the order the columns are displayed by clicking and dragging a column heading to wherever you want it, and then releasing the mouse button.
Process Monitor has ToolTips for the icons you see at the top of its main screen. As you hover the mouse over each of the icons you'll see a short description of what the icon does. For example, the tip provided for the first icon on the left says "Open" (you can save the output of Process Monitor and open it later for analysis). The next icon is the "Save" function, and so on. There aren't that many icons, and visually it's pretty obvious what they do, but I've found a few of them to be particularly useful. In this tip I'll just mention the ones I use the most, and in the tip titled Using Process Monitor I'll go into a bit more depth on how to use them.
A good tool to use is the third from the left: the Capture tool. This freezes the screen and allows you to analyze the snapshot in a variety of ways. The next icon to the right toggles AutoScroll. With this, you can turn off live scrolling yet still have Process Monitor continue to monitor what's going on. When you turn AutoScroll back on it will immediately catch up to the current time.
The fifth icon from the left lets you Clear the display. You would typically use this feature in conjunction with setting filters so that you can start with an empty display and then watch for the activity that you've indicated in your filters.
Speaking of filters, the ability to filter the output is probably the heart of Process Monitor—filtered data becomes very useful information as you are investigating a particular process's behavior. The Filter icon is sixth from the left and looks like an upside-down pyramid.
You exit Process Monitor simply by clicking the Close button or by selecting File | Exit from the menu.
![]()
![]()
![]() This tip (13119) applies to Windows 7, 8, and 10.
This tip (13119) applies to Windows 7, 8, and 10.
AutoHotKeys is a great multi-purpose utility that covers the spectrum from allowing you to define shortcut keys for ...
Discover MoreWith Windows 10 you can easily see how your data is being used. Even if you are not on a metered data plan, it can be ...
Discover MoreEvery time Windows updates the operating system, it seems that they leave out or remove something that somebody loved in ...
Discover MoreThere are currently no comments for this tip. (Be the first to leave your comment—just use the simple form above!)
Copyright © 2026 Sharon Parq Associates, Inc.
Comments