The Task Manager is a useful tool for monitoring system activity, terminating misbehaving processes, and performing some rudimentary performance analysis. It runs at a higher priority than normal applications, and it has sufficient privilege to view and control the system's running processes. There are a few ways to invoke the Task Manager:
Regardless of how you start the program, the Windows Task Manager dialog box appears. The Windows 7 Task Manager dialog box will look similar to this: (See Figure 1.)
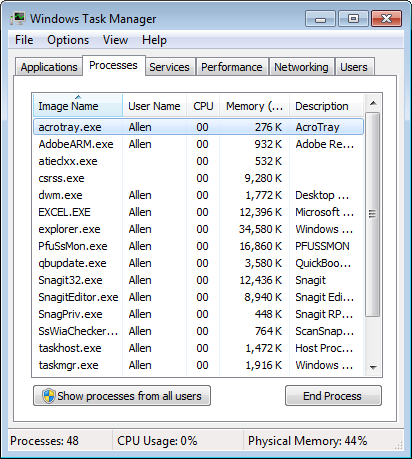
Figure 1. The Task Manager's Processes tab.
If you are using Windows 8 or Windows 10, the Task Manager dialog box will look similar to this: (See Figure 2.)
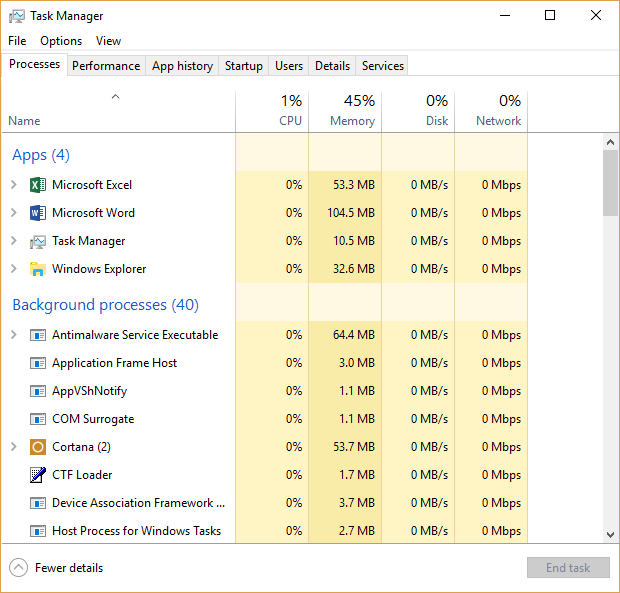
Figure 2. The Task Manager's Processes tab.
Note that of the six tabs (Windows 7) or seven tabs (Windows 8 and Windows 10) present in the dialog box, the Processes tab is current. As can be seen from the figures, the Windows 7 system has 48 processes currently running, and they are sorted alphabetically by Image Name. The Windows 10 system has 4 apps and 40 background processes running, and they are sorted alphabetically by Name. If you scroll down within the Processes window, you will see how many Windows processes are running. If you want them sorted in reverse order, click on the heading of the "Image Name" (Windows 7) or "Name" (Windows 8 and Windows 10) column. If, instead, you want to sort the window by CPU usage, click on the heading of the "CPU" column, etc.
While on the Processes tab with a Windows 7 system, sort the window by CPU usage to see if there are any processes that may be consuming a lot of the CPU. If so, you can right-click the process and reduce its priority or assign it to a particular CPU.
On a Windows 7 system, you can also sort the above window by one of the "memory" columns to see if a process's Working Set or Private Working Set is continually growing. Task Manager on a Windows 8 or Windows 10 system doesn't show whether a process is a Working Set or Private Working Set, but you can still see if the process is continually growing. This could indicate a memory leak, which will eventually adversely impact system performance. If this is the case, you may want to select the process and click the End Process (Windows 7) or End Task (Windows 8 and Windows 10) button to terminate it.
You can also use the information presented in the Performance tab to help evaluate system performance: (See Figure 3.)
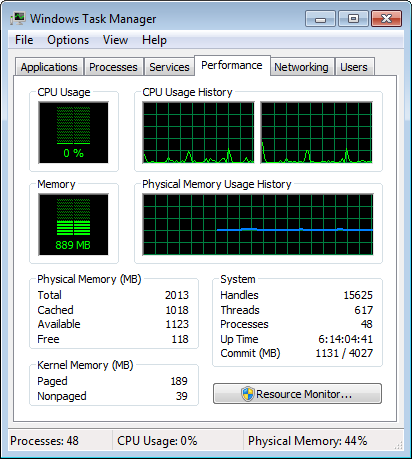
Figure 3. The Task Manager's Performance tab.
If you are using Windows 7, the key numbers to look at here are in the Physical Memory group. Watch the Available memory (1123 above). If this number gets too small relative to the Total memory (2013), then your system will start using the disk as virtual memory and your performance will suffer. Adding more memory to your system can help alleviate this problem.
The Performance tab looks quite different with a Windows 8 or Windows 10 system, as can be seen in the figure below: (See Figure 4.)
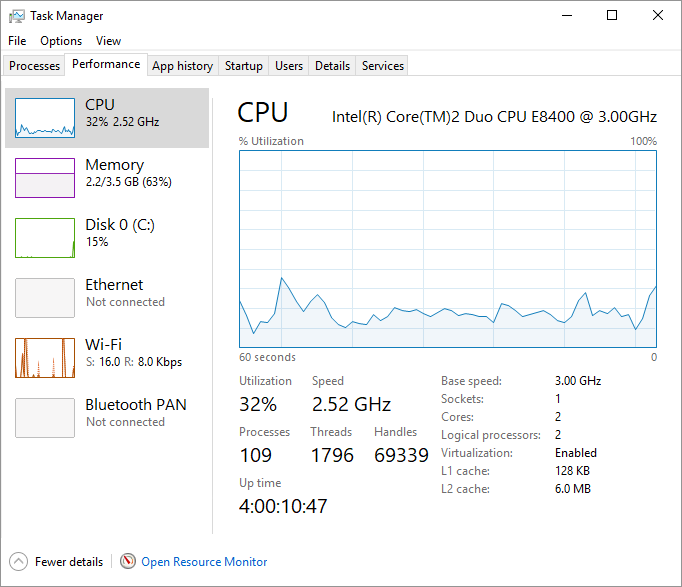
Figure 4. The Task Manager's Performance tab.
Unlike Task Manager on a Windows 7 system, you will need to click on the Memory option if you are using Windows 8 or Windows 10 in order to evaluate how much memory your system is using and what is available to use. (See Figure 5.)
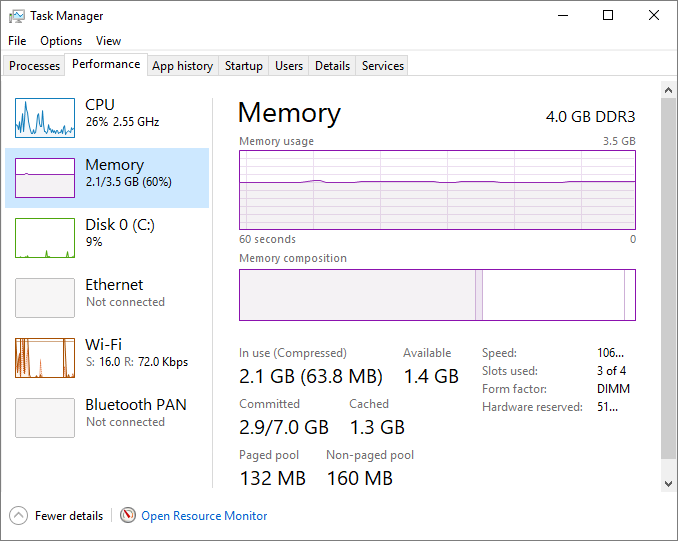
Figure 5. The Task Manager's Memory option of the Performance tab.
The Memory section displays the total amount of memory at the top of the window. The information displayed in the lower-right of the window shows the chip speed, the number of memory slots being utilized, the form factor, and the amount of memory that is reserved for use by the BIOS and peripheral devices' drivers installed on your system. Other numbers to look at are located below the two graphs. Notice the In Use (Compressed) and the Available numbers.
If you hover the mouse pointer over the sections in the second graph (Memory Composition) you'll see that the left section indicates the amount of memory in use and the right section indicates the amount of memory in standby.
To perform an even more detailed analysis, click the Resource Monitor button (Windows 7) or the Open Resource Monitor button (Windows 8 and Windows 10). This brings up the Resource Monitor dialog box. (See Figure 6.)
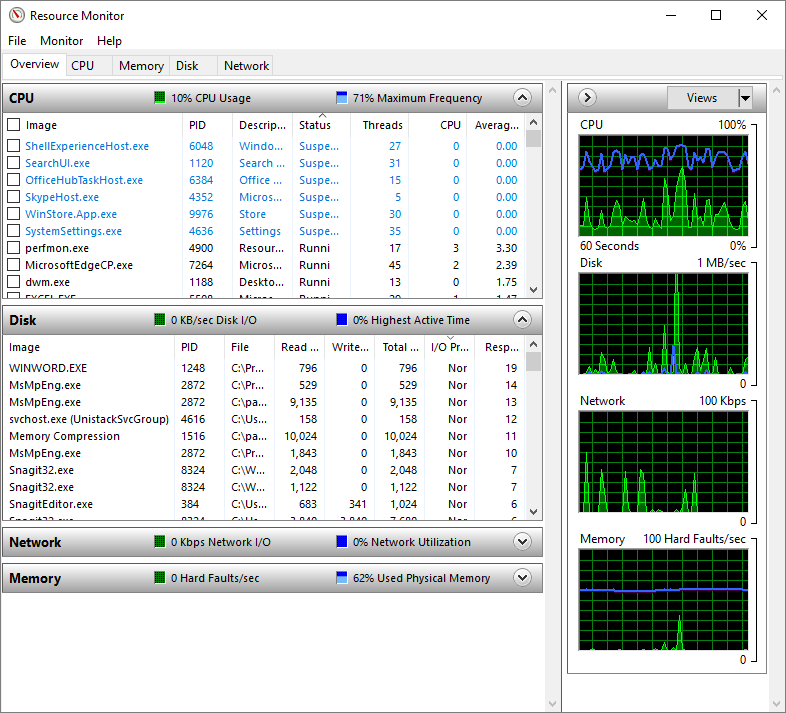
Figure 6. The Resource Monitor window.
By using the Resource Monitor, you can get a good look at the four major components involved in system performance: CPU, Disk, Network, and Memory.
You close both the Resource Monitor as well as the Task Manger by clicking their Close buttons (Windows 7) or the X at the top right corner of the dialog box (Windows 8 and Windows 10).
![]()
![]()
![]() This tip (12225) applies to Windows 7, 8, and 10.
This tip (12225) applies to Windows 7, 8, and 10.
Need to customize how your Windows interface looks? If so, you'll want to use the PC Settings screen. This tip explains ...
Discover MoreYou can change the image that is displayed for your desktop background to a more aesthetically pleasing picture. There ...
Discover MoreMost of the objects that Windows makes available in its interface possess properties. These properties allow you to ...
Discover MoreThere are currently no comments for this tip. (Be the first to leave your comment—just use the simple form above!)
Copyright © 2026 Sharon Parq Associates, Inc.
Comments