Resource Monitor is a part of Task Manager and allows you to see information about critical systems of your PC. It's a nice utility to help you keep an eye on your computer's health, and it helps in diagnosing certain performance problems.
To use Resource Monitor, right-click on an empty area of the taskbar and choose Start Task Manager from the resulting Context menu. Click the Performance tab. (See Figure 1.)
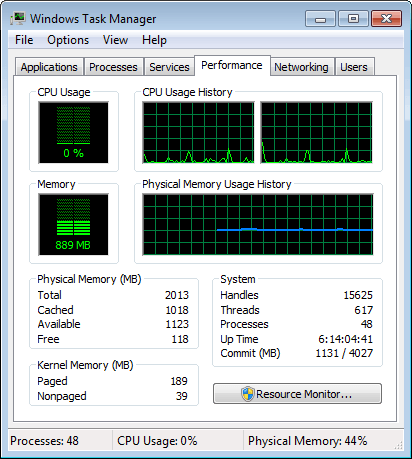
Figure 1. Setting up Task Manager to use the Resource Monitor.
To start the Resource Monitor, click the Resource Monitor button at the bottom of the screen. You can then move the Task Manager window out of the way or even close it. The resource monitor provides quite a bit of information about the CPU, disks, network, and memory in your system. (See Figure 2.)
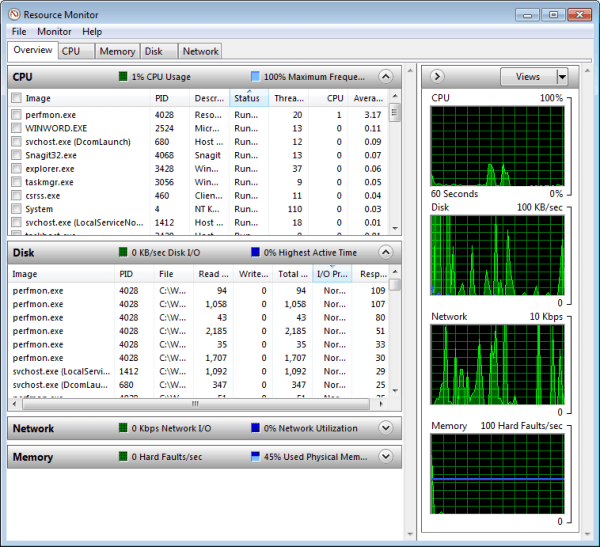
Figure 2. Resource Monitor main screen.
Note the five tabs at the top of the screen. This is the Overview tab; it provides quite a bit of information. On the right are four real-time graphs that indicate how much of each resource (CPU, Disk, Network, and Memory) are being utilized over time. If you click one or more boxes on the left under the CPU category, you'll add a separate line to the CPU graph for the lines you selected (assuming their CPU usage is significant). Clicking a CPU image also filters the remaining resources (Disk, Network, and Memory) so that they're focused only on the selected image(s).
The Disk category is meant to give you an idea of the activity occurring on your hard drive and what images are responsible for this activity.
The Network category provides information about the amount of sent and received network I/O packets that are going through your system.
The Memory category shows how much physical memory is in use and provides information about how many "hard faults" (i.e., paging to disk) are occurring.
Note that for each of the four categories, you can customize the display somewhat by right-clicking on a column header and selecting which columns you want displayed and which columns you want hidden. You can also sort by a displayed column by left-clicking on that column's header.
Once you have an overview of how your system is performing in these key areas, you may want to delve into the details of one or more of the key areas. This is when you click on the other four tabs across the top of the Resource Monitor screen.
When you click the CPU tab you are presented with information separated into four sub-categories: Processes, Services, Associated Handles, and Associated Modules. The graphs on the right also change to reflect Total CPU Usage, Service CPU Usage, and the activity occurring on each of your CPUs (assuming you have a multiprocessor system).
When you click the Memory tab you are presented with information separated into the two sub-categories of Processes and Physical Memory. The graphs on the right also change to reflect Used Physical Memory, the Commit Charge, and how many Hard Faults are occurring per second.
When you click the Disk tab you are presented with information separated into three sub-categories: Processes with Disk Activity, Disk Activity, and Storage. The graphs on the right also change to reflect disk throughput, and the queue lengths of each disk.
Finally, when you click the Network tab you are presented with information separated into four sub-categories: Processes with Network Activity, Network Activity, TCP Connections, and Listening Ports. The graphs on the right also change to reflect the overall Network speed, the number of TCP connections, and the percentage of Local Area connections.
![]()
![]()
![]() This tip (13057) applies to Windows 7, 8, and 10.
This tip (13057) applies to Windows 7, 8, and 10.
Navigating to favorite files or folders need not be a time waster of click through a tree structure. ConFavor makes this ...
Discover MoreWith Windows 10 you can easily see how your data is being used. Even if you are not on a metered data plan, it can be ...
Discover MoreUSB flash drives are a very helpful addition to store and transfer data. Discover how to format a USB drive using File ...
Discover More2017-05-08 14:27:08
Barry
Thanks, Drolv. I'm afraid performance tuning is an entire class in itself. Maybe I could write a series of Tips on tuning, though. Thanks for the idea.
2017-05-08 11:46:41
Drolv
Hey, Barry! How about a followup on what to look for and how to correct obvious errors? Getting to the information is easy now that you've pointed the way. What do we do next?
Copyright © 2026 Sharon Parq Associates, Inc.

Comments